How Do House Prices Affect the Consumer Price Index?
It can seem hard to reconcile the stellar growth in house prices in recent years in Vancouver and some other Canadian urban centres with the modest growth in the consumer price index (CPI). Established house prices in Greater Vancouver and Victoria rose 81% and 56%, respectively, over the past 5 years, whereas the CPI for BC rose only 7.5%.[1],[2] The disconnect is partly due to the way Statistics Canada tracks the cost of “owned accommodation.” In particular, estimates of mortgage interest and other costs facing homeowners are based on the New House Price Index rather than a broader measure of established house prices. The result is that CPI likely understates trends in living costs facing many households in BC and Canada.
CPI measurement has wide-ranging implications
CPI tracks prices for a fixed basket of goods and services bought by consumers.[3] CPI inflation is used by governments as a target for monetary policy, and to adjust tax brackets, transfer payments and pensions. Canadian businesses use past inflation as an informal guide, or view inflation as embedded in market wage rate information, when making decisions about wages (Amirault et al. 2013). CPI measurement therefore has wide-ranging economic and policy implications.
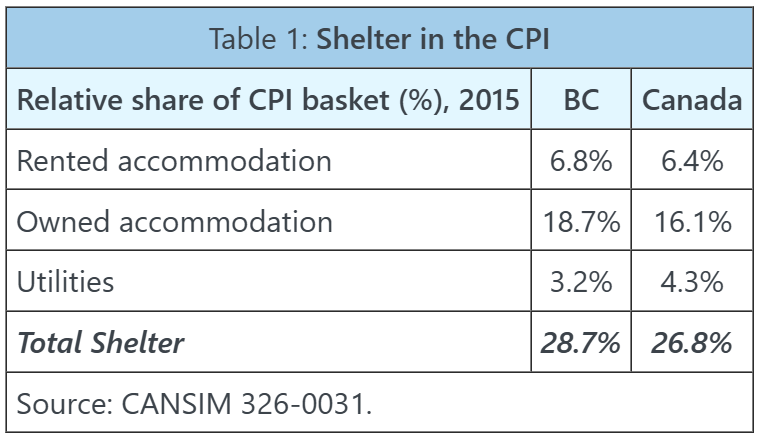
The largest component of CPI is “shelter.” It represents more than a quarter of total CPI for BC and Canada (Table 1). Shelter is made up of three items: rented accommodation, owned accommodation and utilities. The first and third items are straight-forward.[4] Where things get complicated is in tracking the cost of “owned accommodation.” For BC, this item represents roughly two-thirds of the shelter component of the CPI and one-fifth of total CPI.
Defining the cost of “owned accommodation”
Statistical agencies around the world take different approaches to tracking the cost of owned accommodation in the CPI.[5] Statistics Canada treats homeowners as if they were renting their own dwelling, and then tracks the expenses that a landlord would incur.[6] Six expenses are tracked: mortgage interest costs; replacement cost; property taxes; home and mortgage insurance; maintenance and repairs; and other expenses (Table 2).[7]
The first item deserves special attention. The mortgage interest cost index tracks price changes in the amount of interest owed by homeowners on their outstanding mortgage balance (Soumare, 2017). Changes in the index are determined by: changes in interest rates; and changes in mortgage principal outstanding as determined by changes in (new) house prices.[8] Note that the repayment of mortgage principal is not included, only the interest payment itself. The interest rates used are 1-, 3- and 5-year fixed rates facing homeowners at origination or renewal (Statistics Canada, 2015). All else being equal, decreases in interest rates decrease the mortgage interest cost index in the CPI, and vice versa.
Because only small proportions of the mortgage and housing stock are transacted each month, the mortgage interest cost index is based on a weighted average of historical interest rates (rolling 5-year periods) and historical new house prices (rolling 25-year periods).[9] Past interest rates and house prices therefore continue to affect the mortgage interest cost index over time. This is one reason why movements in house prices and (to a lesser extent) interest rates can take a long time to impact the CPI.
However, this is still not the full picture. Another reason for the disconnect is that the measure of house prices used to construct the mortgage interest cost index (see above) and the replacement cost index is the New House Price Index.[10],[11] The New House Price Index is based on “contractors’ selling prices for new dwellings (including land) collected from builders in more than twenty cities” (Statistics Canada 2015, 8). The series covers new single-family homes, semi-detached homes and townhouses and has been used in the calculation of the CPI since 1970.
Broader measures of established house prices have since been developed. CREA MLS House Price Index and Teranet-National Bank House Price Index provide data for 2005-2018 and 1990-2018, respectively. They track the prices of single family homes, townhouses and apartments that have sold each month.[12]
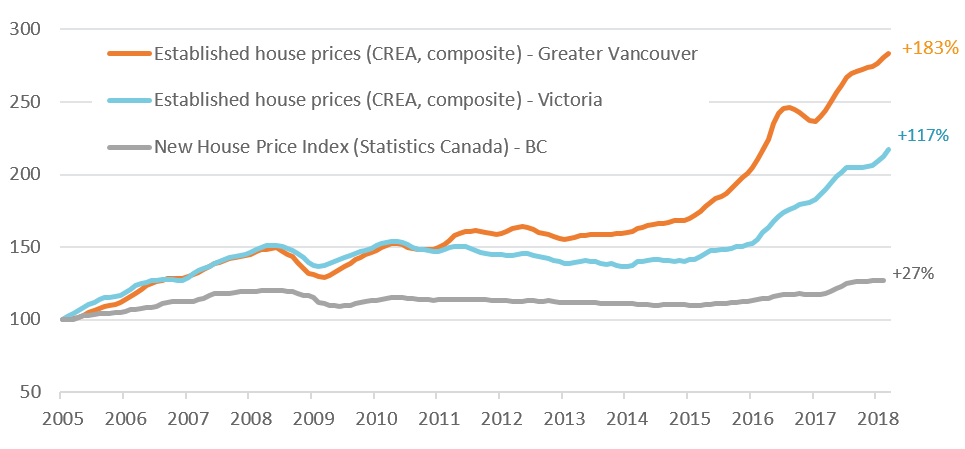
These measures show that the rate of appreciation in established house prices vastly outpaces the growth in new house prices. BC new home prices are up only 27% since 2005, compared to established house price growth of 183% for Greater Vancouver and 117% for Victoria (Figure 1). The same is true for Canada: new house prices are up 47% since 2005, compared to established house price growth of 136%.
Figure 1: BC Established House Prices Outpace New House Prices
2005 = 100
Source: CREA HPI, CANSIM 327-0056.
What has happened to CPI shelter costs?
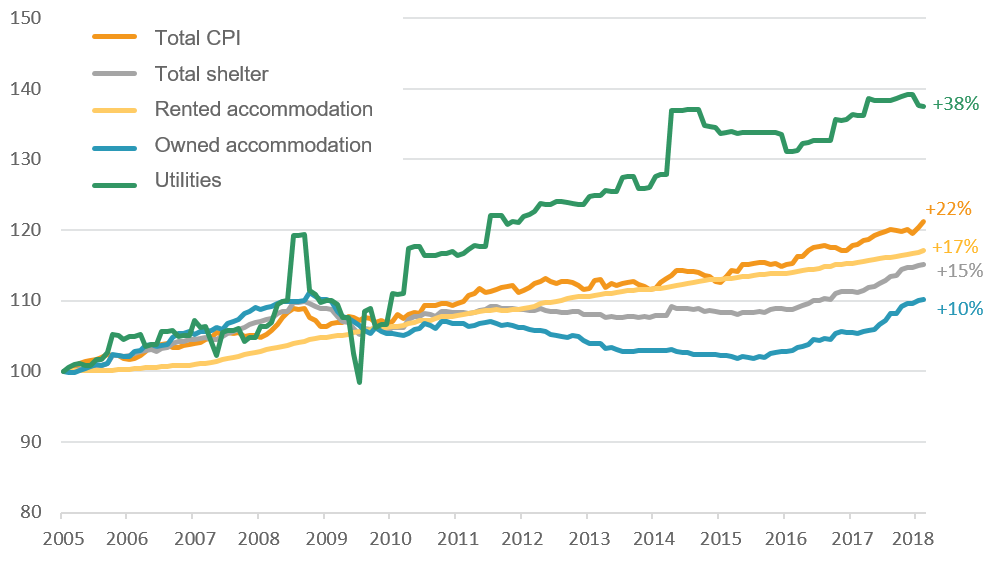
CPI shelter costs in BC have increased only 15% since 2005, compared to 22% for total CPI (Figure 2).[13] “Owned accommodation” costs – roughly two-thirds of shelter and one-fifth of total CPI – rose only 10%. Most of that increase occurred after 2015. The decline in owned accommodation costs across 2008-2015 is likely explained by the effects of declining interest rates, and flat new house price growth, on the mortgage interest cost index. By comparison, “rented accommodation” costs rose 17% over 2005-2018. The largest price rise came from the smallest and most volatile item, utilities, which increased 38%.
Figure 2: BC CPI Shelter Costs Show Only Modest Increase
2005 = 100
Source: CANSIM 372-0020.
Conclusion
CPI measurement has wide-ranging economic and policy implications. In tracking the cost of the largest component, shelter, an often overlooked question is which house price series – the New House Price Index or a broader measure of established house prices – best reflects the mortgage interest and other costs actually facing homeowners. If most homeowners live in and pay mortgages on established dwellings built more than 25 years ago, then there is an argument for producing a measure of CPI that relies on a broader measure of house prices. This would be an interesting line of inquiry for Statistics Canada to pursue. In the meantime, the reported changes in the shelter component of the CPI likely understate the true shelter cost inflation facing many homeowners in BC and Canada.
References
Amirault, D., Fenton, P. and T. Lafleche. “Asking About Wages: Results from the Bank of Canada’s Wage Setting Survey,” Bank of Canada Discussion Paper 2013-1.
Kostenbauer, K. 2001. “Housing Depreciation in the Canadian CPI,” Statistics Canada Catalogue 62F0014MIE, Series No. 15.
Soumare, A., 2017. “Shelter in the CPI: An Overview,” Statistics Canada Catalogue 62F0014M, 22 September.
Statistics Canada Blog, 2017. “Tracking the Cost of Shelter,” 2 October.
Statistics Canada, 2015. “The Canadian Consumer Price Index Reference Paper: Chapter 10 – Treatment of Owned Accommodation and Seasonal Products,” Statistics Canada Catalogue no. 62-553-X.
[1] For Canada as a whole, established house prices rose 48% over the past 5 years while CPI rose only 8.1%.
[2] The house price data quoted is the MLS House Price Index (Canadian Real Estate Association, CREA).
[3] The CPI basket weights are updated every two years based on the Survey of Household Expenditure. The most recent update was for 2015.
[4] The rented accommodation index tracks changes in the price paid by tenants of private dwellings (excluding the effects of changes in property quality), as reported from the monthly Labour Force Survey (LFS). LFS data includes responses from about 9,000 tenants across Canada each month. Utilities, the smallest and most volatile component of shelter, tracks changes in the prices of electricity, water and fuels used in the home.
[5] See Kostenbauer (2001) and Soumare (2017) for further discussion.
[6] Statistics Canada’s approach is a quasi- “user cost” approach. Relative to a “pure” user cost approach, they exclude two items: the opportunity cost (next best use) of the capital the homeowner has invested in the house; and the homeowner’s anticipated capital gain (which reduces ownership costs).
[7] Property taxes are estimated from municipal offices and are reflected once per year in the October CPI.
[8] The house price measure used is the New House Price Index, an issue we will return to shortly.
[9] “The weights reflect the distribution of mortgage balances by mortgage vintage, such that older mortgages have a relatively lower weight. This is because newer mortgages generally have a higher principal owing than older mortgages” (Soumare 2017, 6).
[10] To calculate replacement cost, respondents in the Survey of Household Spending are asked how much they think they would receive if they sold their house. This estimate is multiplied by a house/property ratio to estimate the value of the structure excluding land. A depreciation rate of 1.5% is applied to structure value. To estimate monthly price movements associated with replacement cost, Statistics Canada uses a version of the New House Price Index that excludes land-related price changes (Soumare, 2017).
[11] House prices also impact home and mortgage insurance costs. However, here Statistics Canada relies on a third-party insurance database (estimated quarterly) to measure changes in the value of the replacement cost of properties (Statistics Canada, 2015).
[12] They use different methodologies to remove the effects of changes in the characteristics of properties sold.
[13] These statistics will seem hard to accept for the one-third of Metro Vancouver households that spend in excess of 30% of their total income on housing-related costs. See St-Laurent (2017) and 2016 Census release.


