
Examining growth in B.C.’s infrastructure capital stock – where is the private sector?
Recent issues of BCBC’s Policy Perspectives examined trends in British Columbia’s investment per worker (Williams 2022a) and net capital stock per available worker (Williams 2022b). The capital stock is important because workers are more productive when they have more (and more advanced) facilities, machinery and equipment, technologies, and intellectual property products to work with. Higher capital investment per worker increases labour productivity, which leads to higher real pay for workers (Williams 2021). The capital stock per available worker is therefore an important determinant of a country’s average real wage levels and overall living standards (see Figure 1 in Robson and Wu, 2021).This blog examines infrastructure, a subset of the total capital stock. Infrastructure assets are the backbone of a modern economy as they enable people to connect to physical networks for energy, services, information and communications, jobs, water, sport, recreation and worship, transit, transport, and trade. Whilst there is no universally accepted definition, Statistics Canada defines infrastructure as “the physical structures and systems that support the production of goods and services and their delivery to and consumption by governments, businesses and citizens” (see here).Infrastructure includes tangible economic and social assets such as:
commercial buildings – airports, spectator and indoor sports facilities, communications buildings;
institutional buildings – churches, schools, universities, hospitals, nursing homes, libraries, museums, historical sites;
marine engineering infrastructure – seaports, canals, marinas and harbours;
transportation engineering infrastructure– roads, bridges, tunnels, railway lines, airport runways;
waterworks infrastructure – water networks and filtration plants;
sewage infrastructure – wastewater networks and treatment plants;
communications networks – cables and lines, optical fibre, support structures;
electrical power networks – hydraulic, nuclear, wind, solar and steam production plants, power transmission and distribution networks;
oil and gas engineering construction – pipelines;
transportation machinery and equipment – buses, locomotives and rolling stock, transit equipment;
other machinery and equipment – turbines, transformers, water treatment equipment; and
other engineering construction – waste disposal facilities, outdoor sports facilities, environmental protection.
Economic contribution of infrastructure
According to Statistics Canada’s Infrastructure Statistics Hub, gross investment in infrastructure assets contributed in 2021:
$67.1 billion of GDP in Canada ($1,800 per capita);
$11.4 billion of GDP in B.C. ($2,200 per capita);
$41.3 billion of employee pay across 550,000 jobs in Canada ($75,000 per job annually); and
$6.6 billion of employee pay across 92,000 jobs in B.C. ($72,000 per job annually).
Long-run trends in the infrastructure capital stock
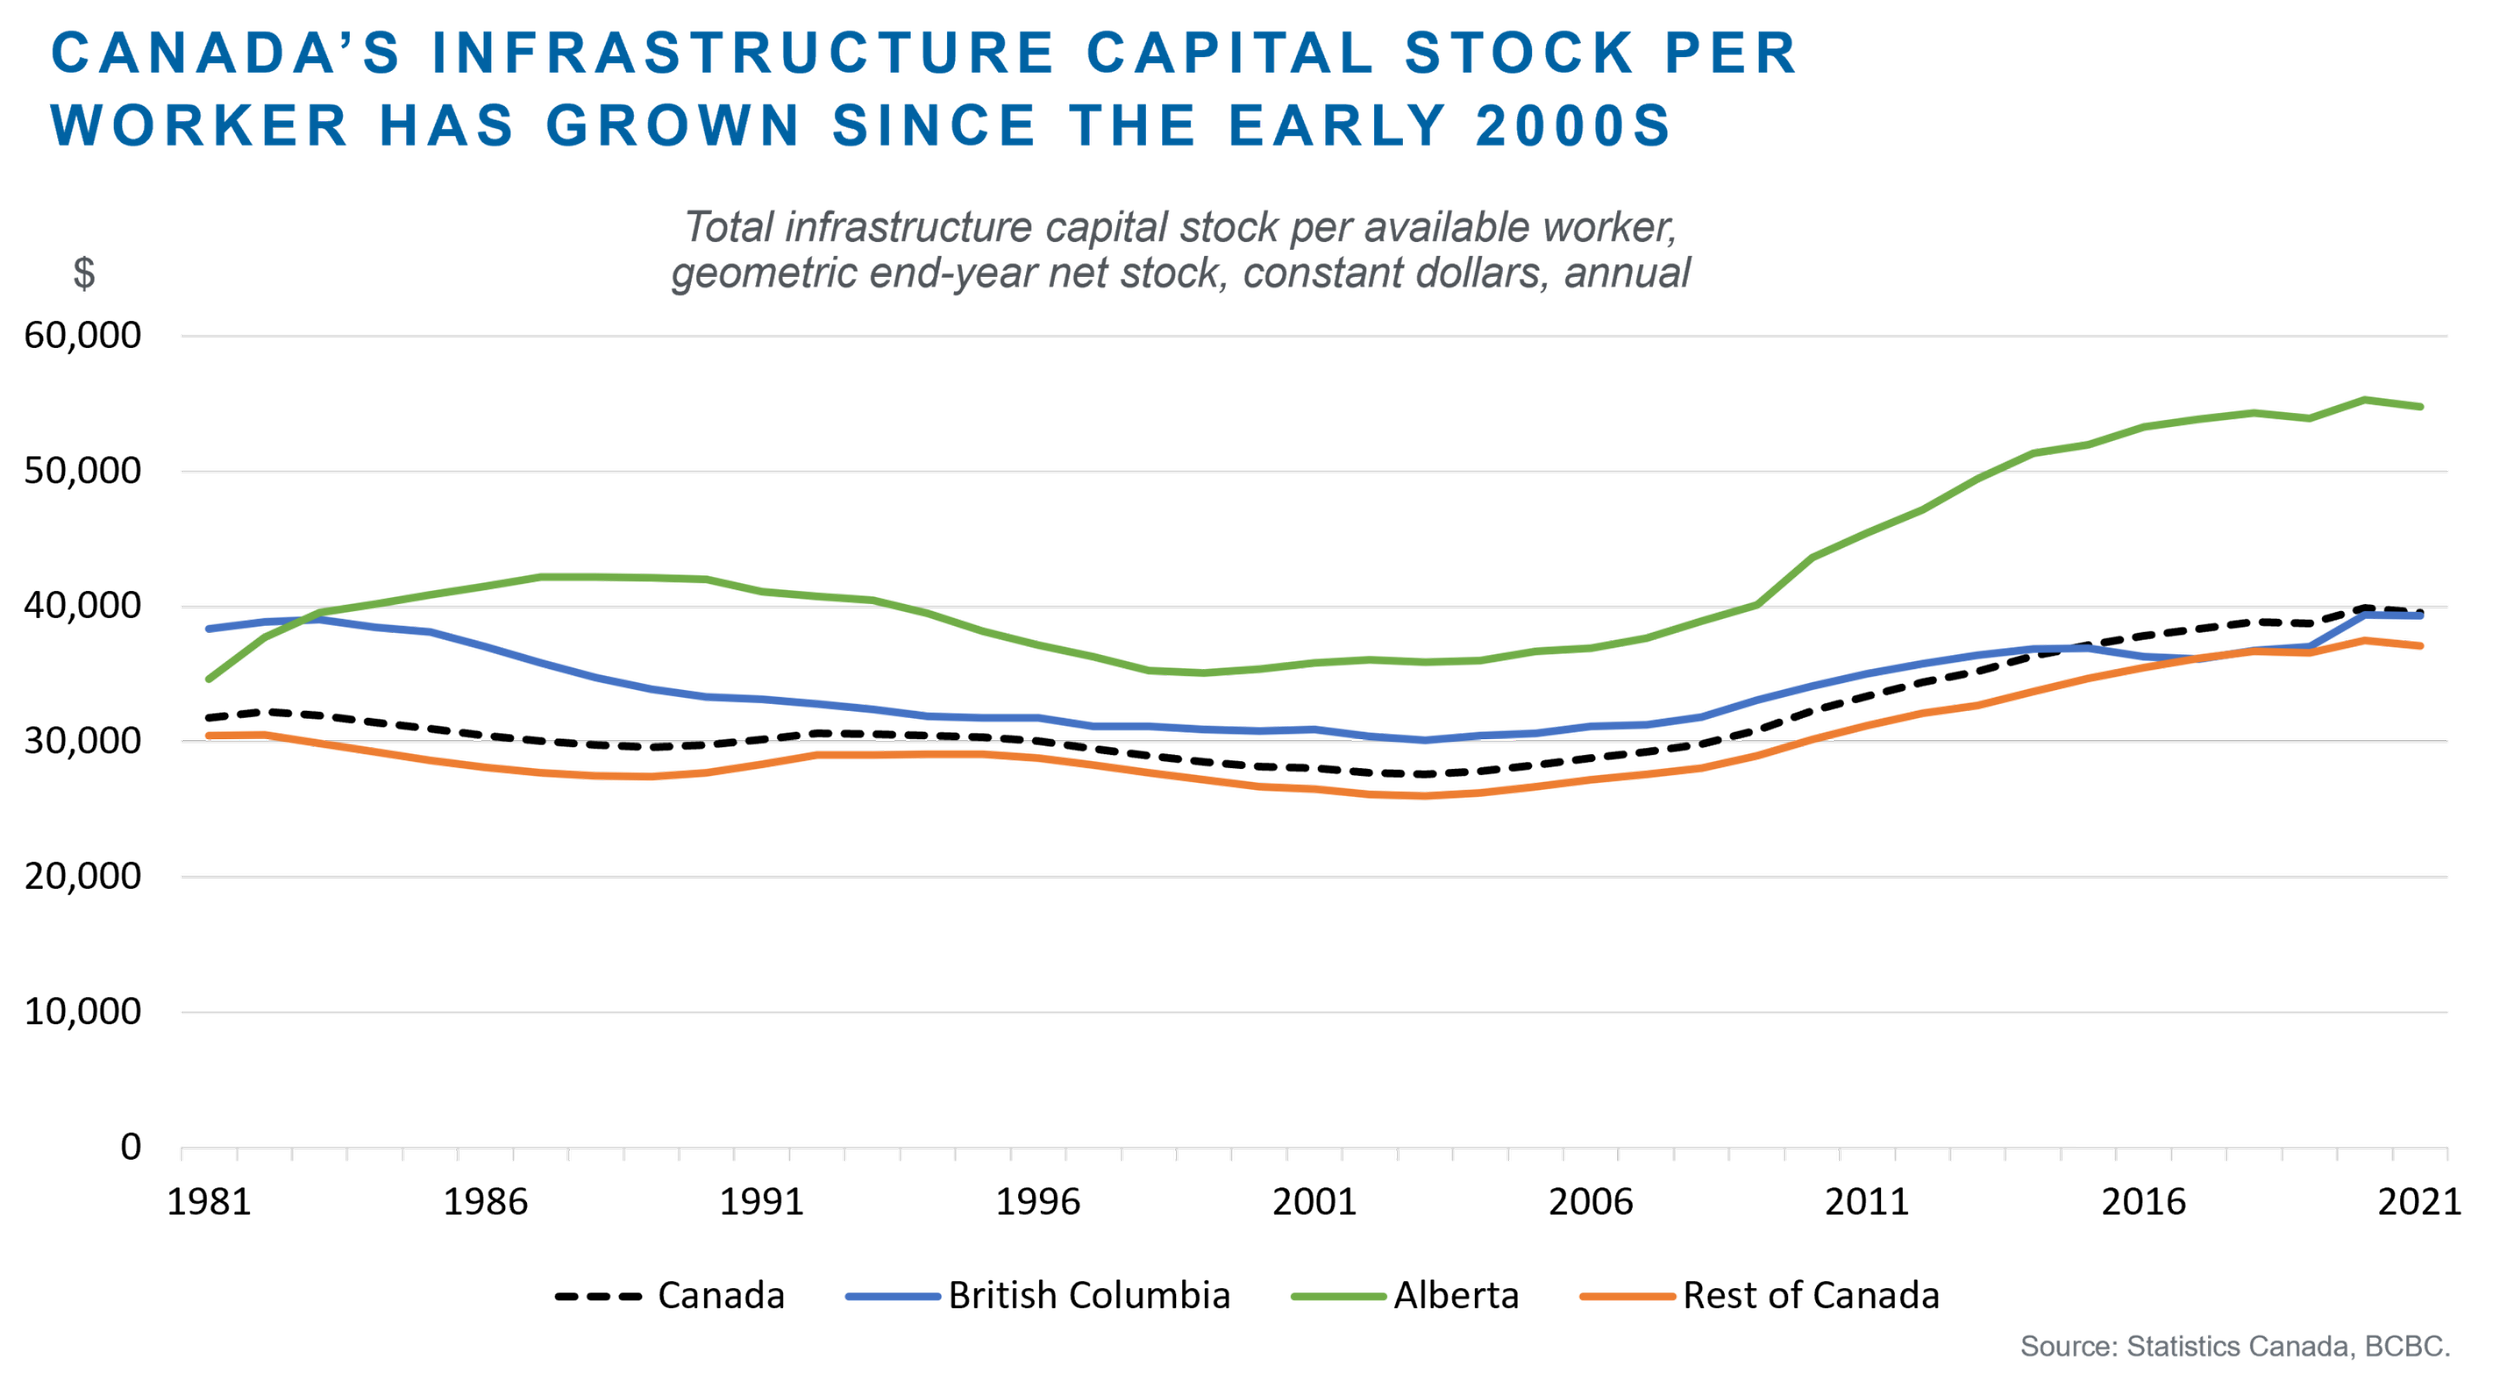
Let’s now examine long-run trends in the infrastructure net capital stock. The net stock is accumulated gross investment, less asset retirements and depreciation. Figure 1 shows the real (constant dollar) total infrastructure net capital stock per available worker over 1981-2021 for B.C., Alberta, Canada and the “Rest of Canada” (i.e., Canada excluding Alberta and B.C.).[1]Due to depreciation, asset retirements, and a lack of new investment, B.C.’s total infrastructure capital stock per available worker declined from $38,000 in 1981 to a low of $30,000 in the early 2000s. It then gradually recovered to $39,000 by 2021, about where it was in 1981. This is far below Alberta ($55,000), but on par with Canada ($40,000) and the Rest of Canada ($37,000).
Figure 1
With the exception of Alberta, growth in Canada’s infrastructure capital stock per available worker since the 2000s has been overwhelmingly concentrated in the public sector (Figure 2). Outside Alberta, the private sector infrastructure capital stock per available worker has declined over the past three decades. In B.C., it has fallen from $15,000 in 1981 to just $11,000 in 2021. It has also declined in the Rest of Canada from $9,700 in 1981 to $9,100 in 2021.Meanwhile, B.C.’s public sectorinfrastructure capital stock per available worker has grown from $23,000 in 1981 to $28,000 in 2021 – on par with Canada and the Rest of Canada – but still less than Alberta. Alberta’s infrastructure capital stock per available worker in 2021 stood at $31,000 in the public sector (13% higher than B.C.) and $23,000 in the private sector (doublethat of B.C.).
Figure 2
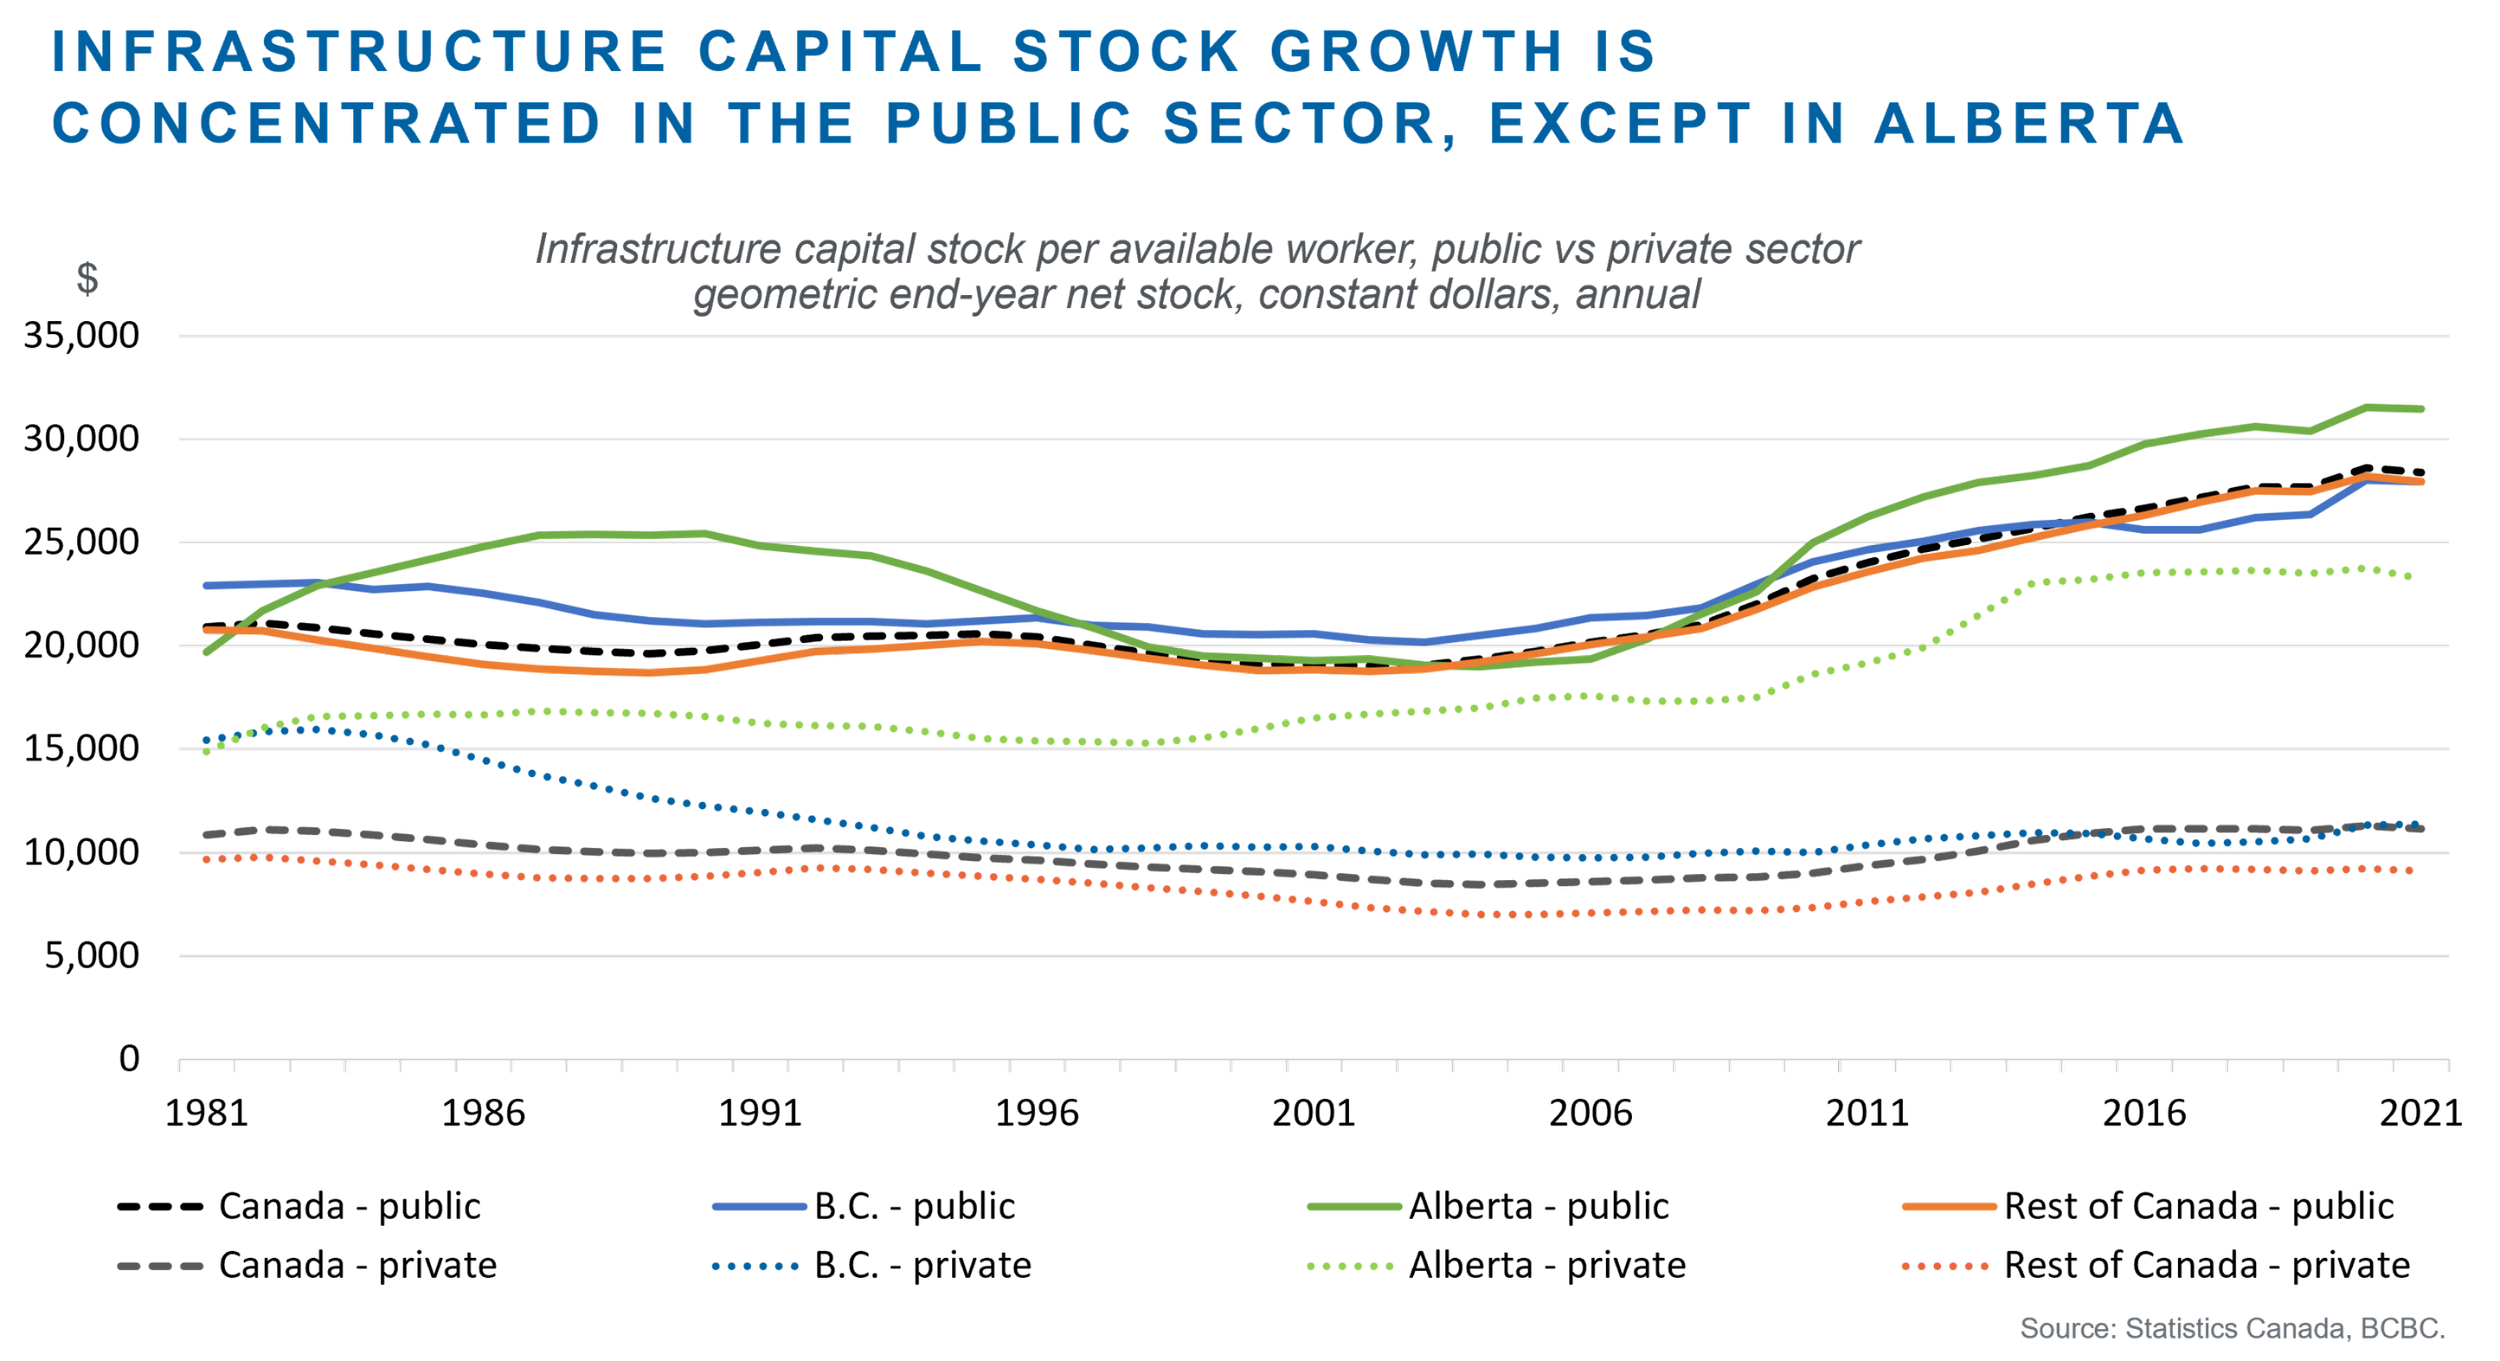
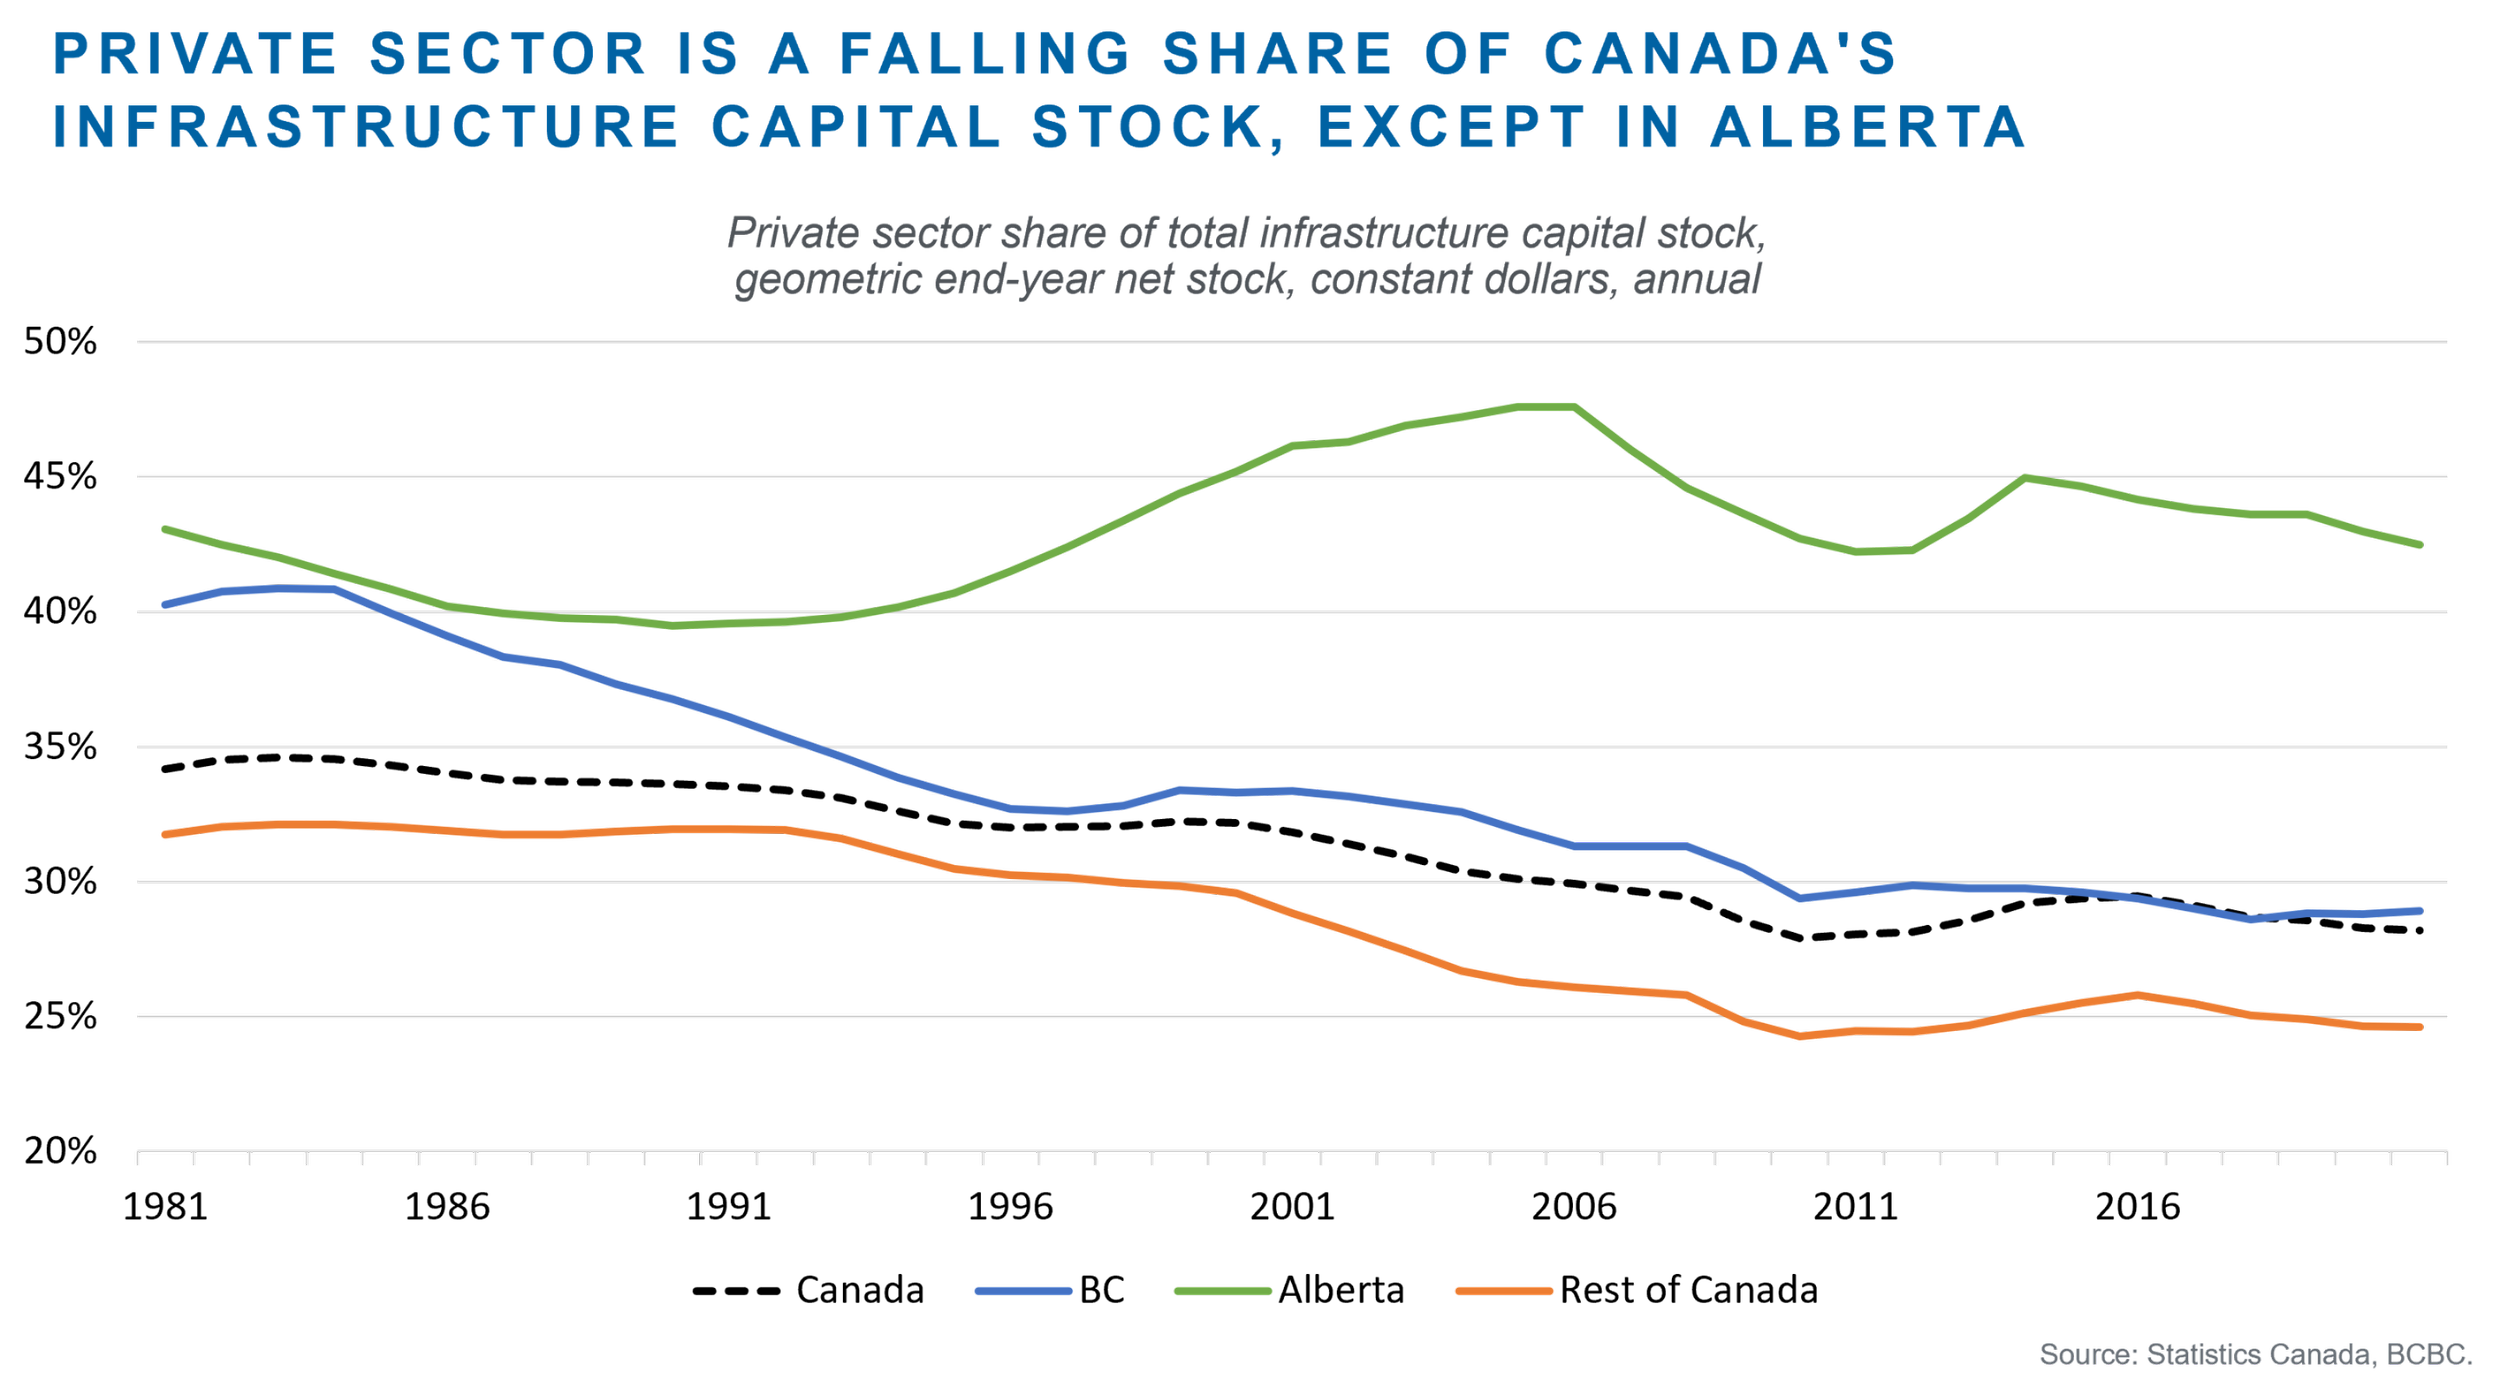
Figure 3 shows the shareof the infrastructure capital stock in the private and public sectors. Since 1981, Alberta has maintained a relatively steady private-public split with, on average, 43% of infrastructure in the private sector and 57% in the public sector. Outside Alberta, Canada’s private sector infrastructure capital stock per worker has declined both outright and as a share of total infrastructure.In B.C., the private sector accounted for 40% of the total infrastructure capital stock in 1981 (almost on par with Alberta’s 43%), compared to only 29% in 2021. The private sector share has also declined in Canada (34% in 1981 versus 28% in 2021) and the Rest of Canada (32% in 1981 versus only 25% in 2021).
Figure 3
Discussion
B.C.’s total infrastructure capital stock per available worker is growing solely because of growth in the public sector. This also holds true for other parts of Canada – except in Alberta, where the private sector is a major contributor to infrastructure investment. For B.C. and the Rest of Canada, the private sector infrastructure capital stock per available worker is shrinking as a share of total infrastructure. It is also declining in absolute terms.Could this be a measurement issue? Perhaps part of the increase in the public sector infrastructure capital stock per available worker reflects private sector funding (e.g., from pension funds and institutional investors) through public-private partnerships (“P3s”). Such partnerships involve the public sector owning the infrastructure, but the private sector partner earns a commercial return by bearing a share of the risks around the project’s planning, design, financing, construction, service delivery, or maintenance. While this hypothesis is plausible, it is less convincing when considering the absence of change in the private versus public infrastructure capital stock composition in Alberta.
Conclusion
For a modern economy, infrastructure plays a central role in determining average living standards and citizens’ quality of life. Investment contributes to GDP per person and the creation of well-paying jobs. Based on Statistics Canada data, businesses outside Alberta do not appear to view B.C. and the Rest of Canada as attractive markets for new infrastructure investment projects. This could be because: (a) they see a lack of market opportunities; (b) market opportunities are stymied by costly weaknesses in regulatory approvals processes (see Hunsberger et al. 2020, for example); and/or (c) risks of regulatory changes and permitting delays are considered prohibitively high, such that private firms will only participate through P3s (so that governments bear the project’s regulatory risks).The corollary is that policymakers in Ottawa and Victoria should prioritise regulatory reforms that would open opportunities for private sector infrastructure investment – for example, by reducing the time necessary to gain regulatory approvals. Higher private sector investment would help raise living standards in B.C. and the Rest of Canada.[1] The numerator is the real (price-adjusted) geometric end-year infrastructure net capital stock in constant dollars from Statistics Canada Table 36-10-0608-01. As in Williams (2022a and 2022b), based on Robson and Wu (2021), the denominator, available worker, is the number of persons in the labour force. Note that hyperbolic depreciation may be a more suitable depreciation profile for a long-lived asset, such as a road network, that loses a large share of its usefulness towards the end of its life. The data is only available for geometric depreciation.