
Ottawa instigated an epic credit boom, and the party is almost over. It’s time to focus on growing GDP per capita and real incomes
In a recent Globe and Mail article, business leaders across the country lamented that Ottawa’s policies in recent years have created a “sugar pops” economy. The analogy refers to federal policies that keep our economy buzzing on a “sugar high” of short-term macroeconomic stimulus but offer little to engender long-term prosperity through higher productivity, business investment per worker, and real incomes.
Our BCBC article in December 2021 and a related column in the Globe and Mail in February laid out some of the key facts. Over 2007-20, growth in Canada’s real GDP per person was 0.8% per annum. This placed us in the third quartile of advanced countries – towards the back, but not at the very back. However, other countries are projected to move ahead of us in coming years by making their economies more productive while Canada remains stuck in the slow lane.
The OECD projects that Canada will achieve growth of real GDP per person of 0.7% per annum over 2020-30 and 0.8% over 2030-60. It is important to note that these growth rates are on par with what Canada achieved over 2007-20. However, for both 2020-2030 and 2030-2060, the OECD’s forecast places Canada dead last out of 38 advanced countries in terms of growth in real GDP per person. Our sustained poor performance is due to low rates of labour productivity growth, business investment per worker, innovation, export-orientation, and business scaling.
How did we get here?
“Sugar highs” – the credit booms of the 2002-12 and 2020-22
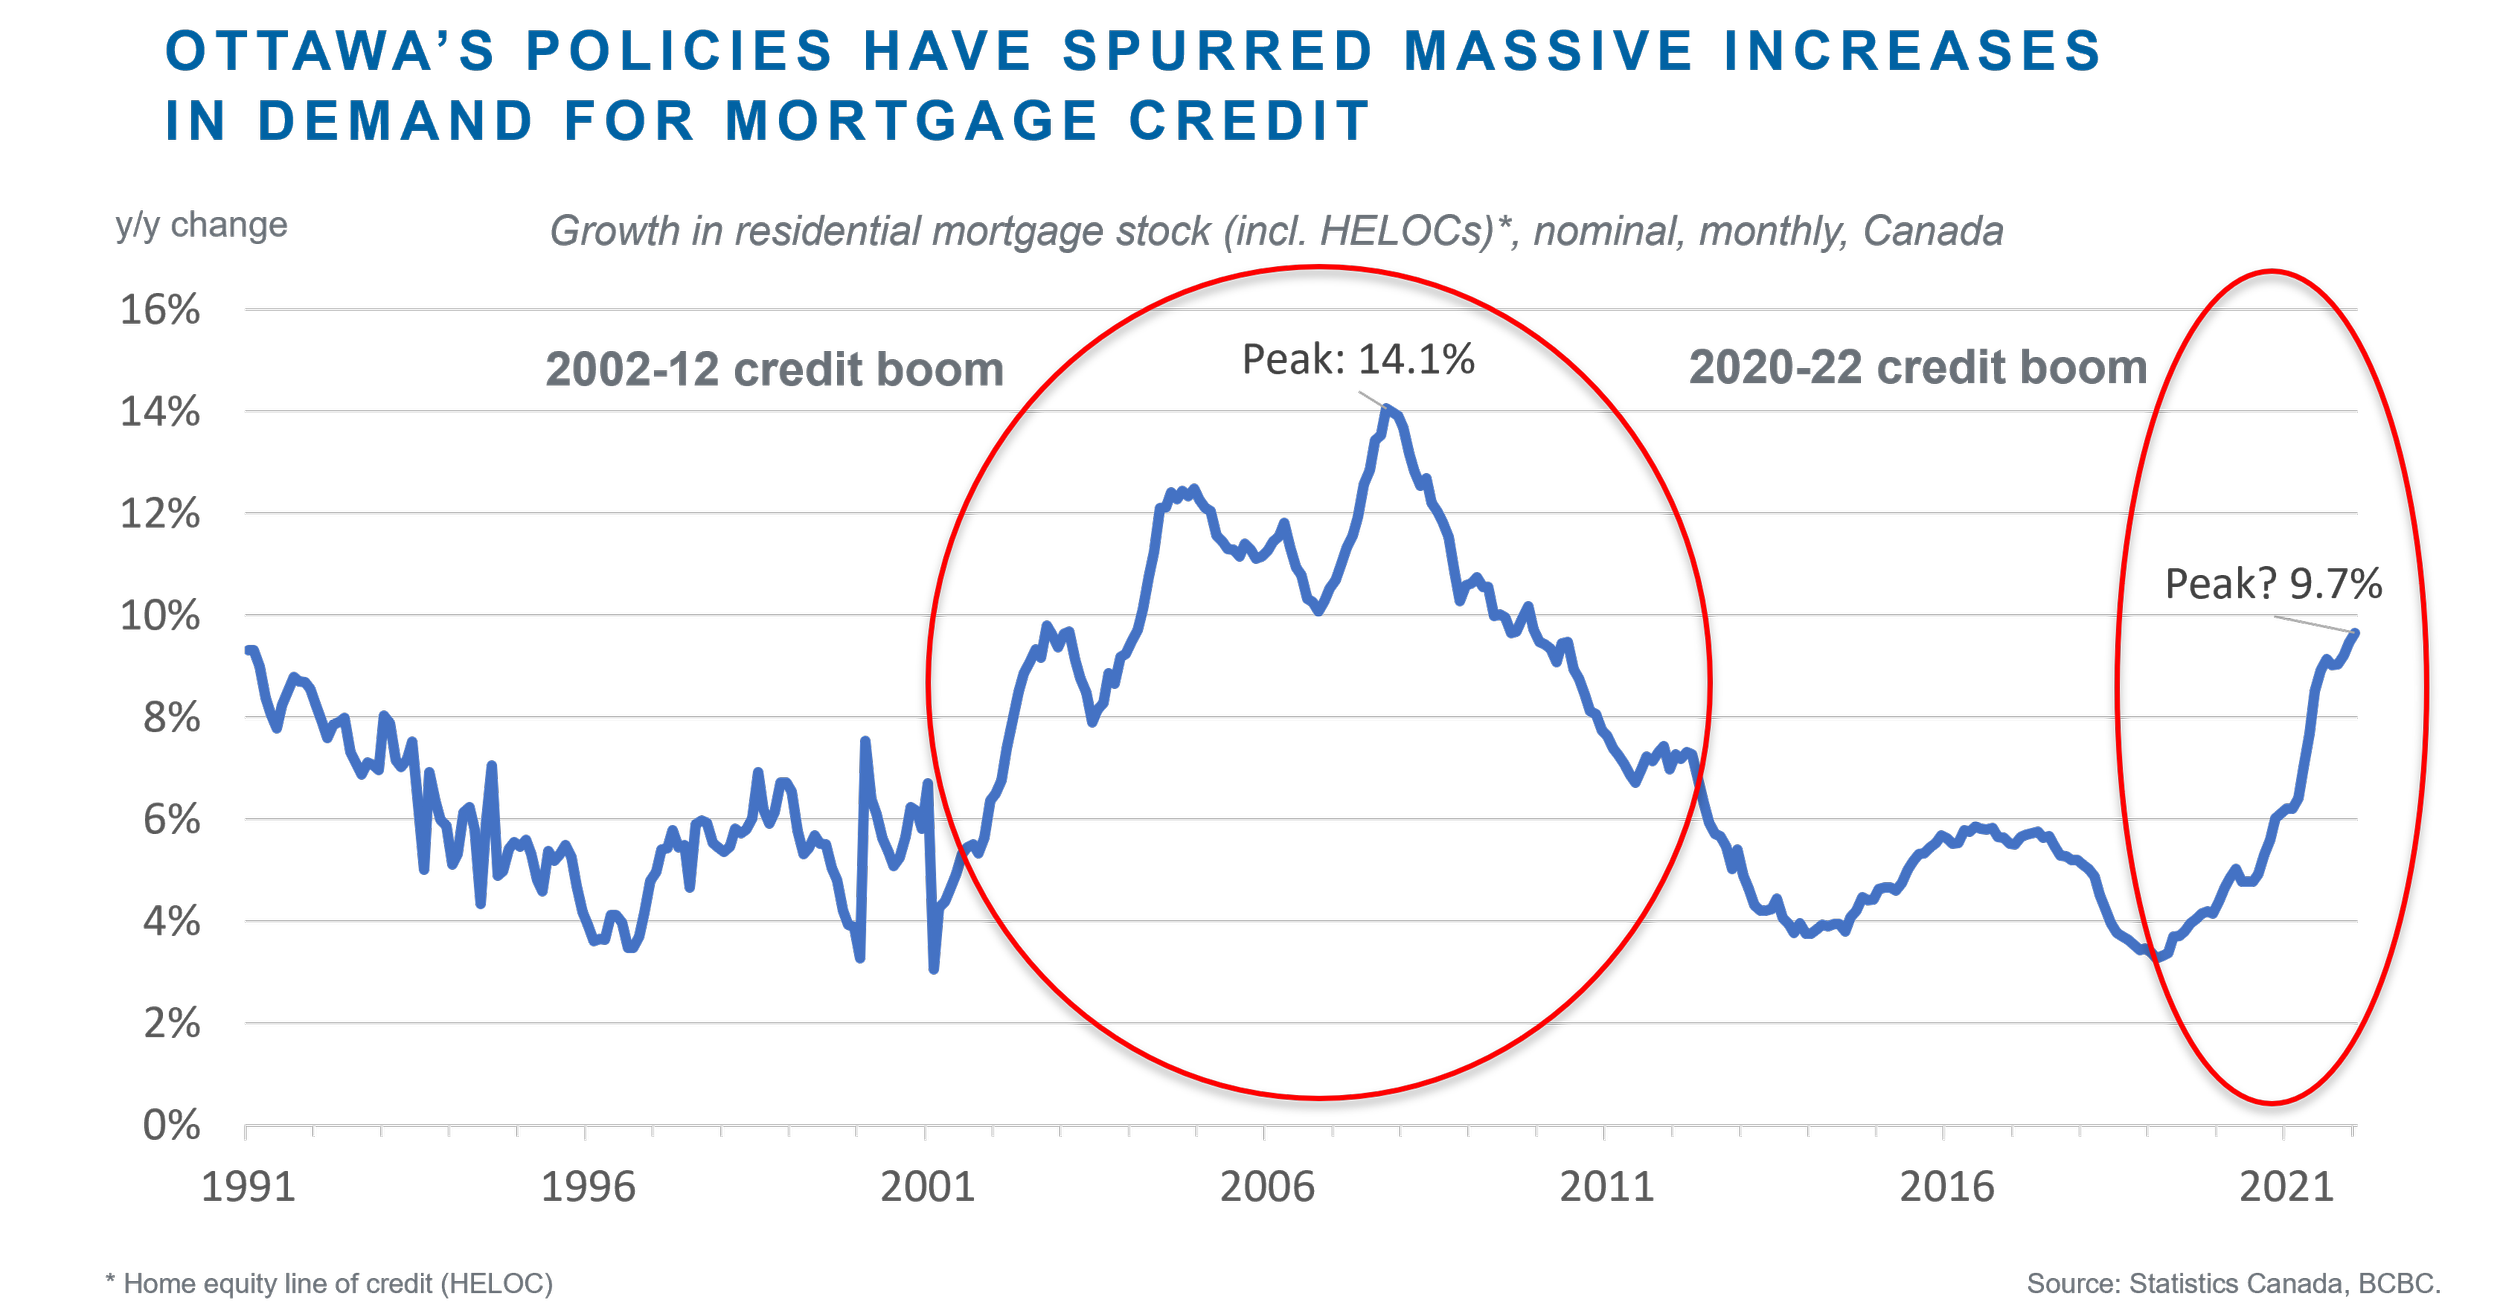
As Canada’s productivity growth waned after 2000 (see Williams 2021), federal policymakers increasingly came to lean on policies that substantially increased households’ access to residentially-secured credit. Against a backdrop of declining interest rates, macroprudential policies were supportive of greater financial innovation and credit expansion (examples of such policies are listed on page 59 of Muellbauer et al. 2015). Figure 1 shows yearly growth in mortgage credit since 1991. The 2002-12 credit boom was remarkable. Double digit annual growth rates in mortgage credit peaked at 14.1% y/y in the months before the Global Financial Crisis (GFC) of 2008-09 and remained strong for several years thereafter with the assistance of low post-GFC interest rates.
The 2020-22 credit boom has been almost as spectacular, with growth in mortgage credit of nearly 10% y/y in January 2022. The period since the COVID-19 pandemic began has featured extraordinarily low interest rates (especially in real or after-inflation terms), forward guidance that interest rates would remain “low for a long time”, no offsetting tightening of macroprudential guidelines, and unprecedented household income support from the federal government (as highlighted in Williams and Finlayson, 2022). In aggregate, household disposable income increased during than the pandemic because government income supports for individuals more than offset the fall in households’ market incomes caused by job losses. Whilst the economy certainly required extraordinary support throughout the initial stages of the pandemic in 2020, it is much harder to argue that demand required emergency levels of fiscal and monetary stimuli in the second half of 2021 and into 2022 as the Canadian economy returned to full capacity and labour shortages became pervasive.
Figure 1
Negative real interest rates for mortgages!
Our message to Canadians is that interest rates are very low and they’re going to be there for a long time. If you’ve got a mortgage or if you’re considering making a major purchase, or you’re a business and you’re considering making an investment, you can be confident rates will be low for a long time.
- Bank of Canada Governor Tiff Macklem, July 2020
During the pandemic, Ottawa again turned to stimulating demand for credit and housing assets to support the overall economy. The Bank of Canada issued forward guidance that policy interest rates would remain “low for a long time” (see quote above) and until its 2% inflation target was sustainably achieved, which it said would not occur until 2023. In June 2021, that commitment was revised to “not until the second half of 2021”. In October 2021, the commitment was again revised to “not until Q2 to Q3 2022”. Subsequently, variable mortgage rates dropped to a historic low of 1.29% in nominal terms by March 2022 (Figure 2). Despite the economy having returned to full employment in late 2021, and CPI inflation running at more than triple the Bank of Canada’s target, variable mortgage rates are still incredibly low at around 1.45%.
Figure 2

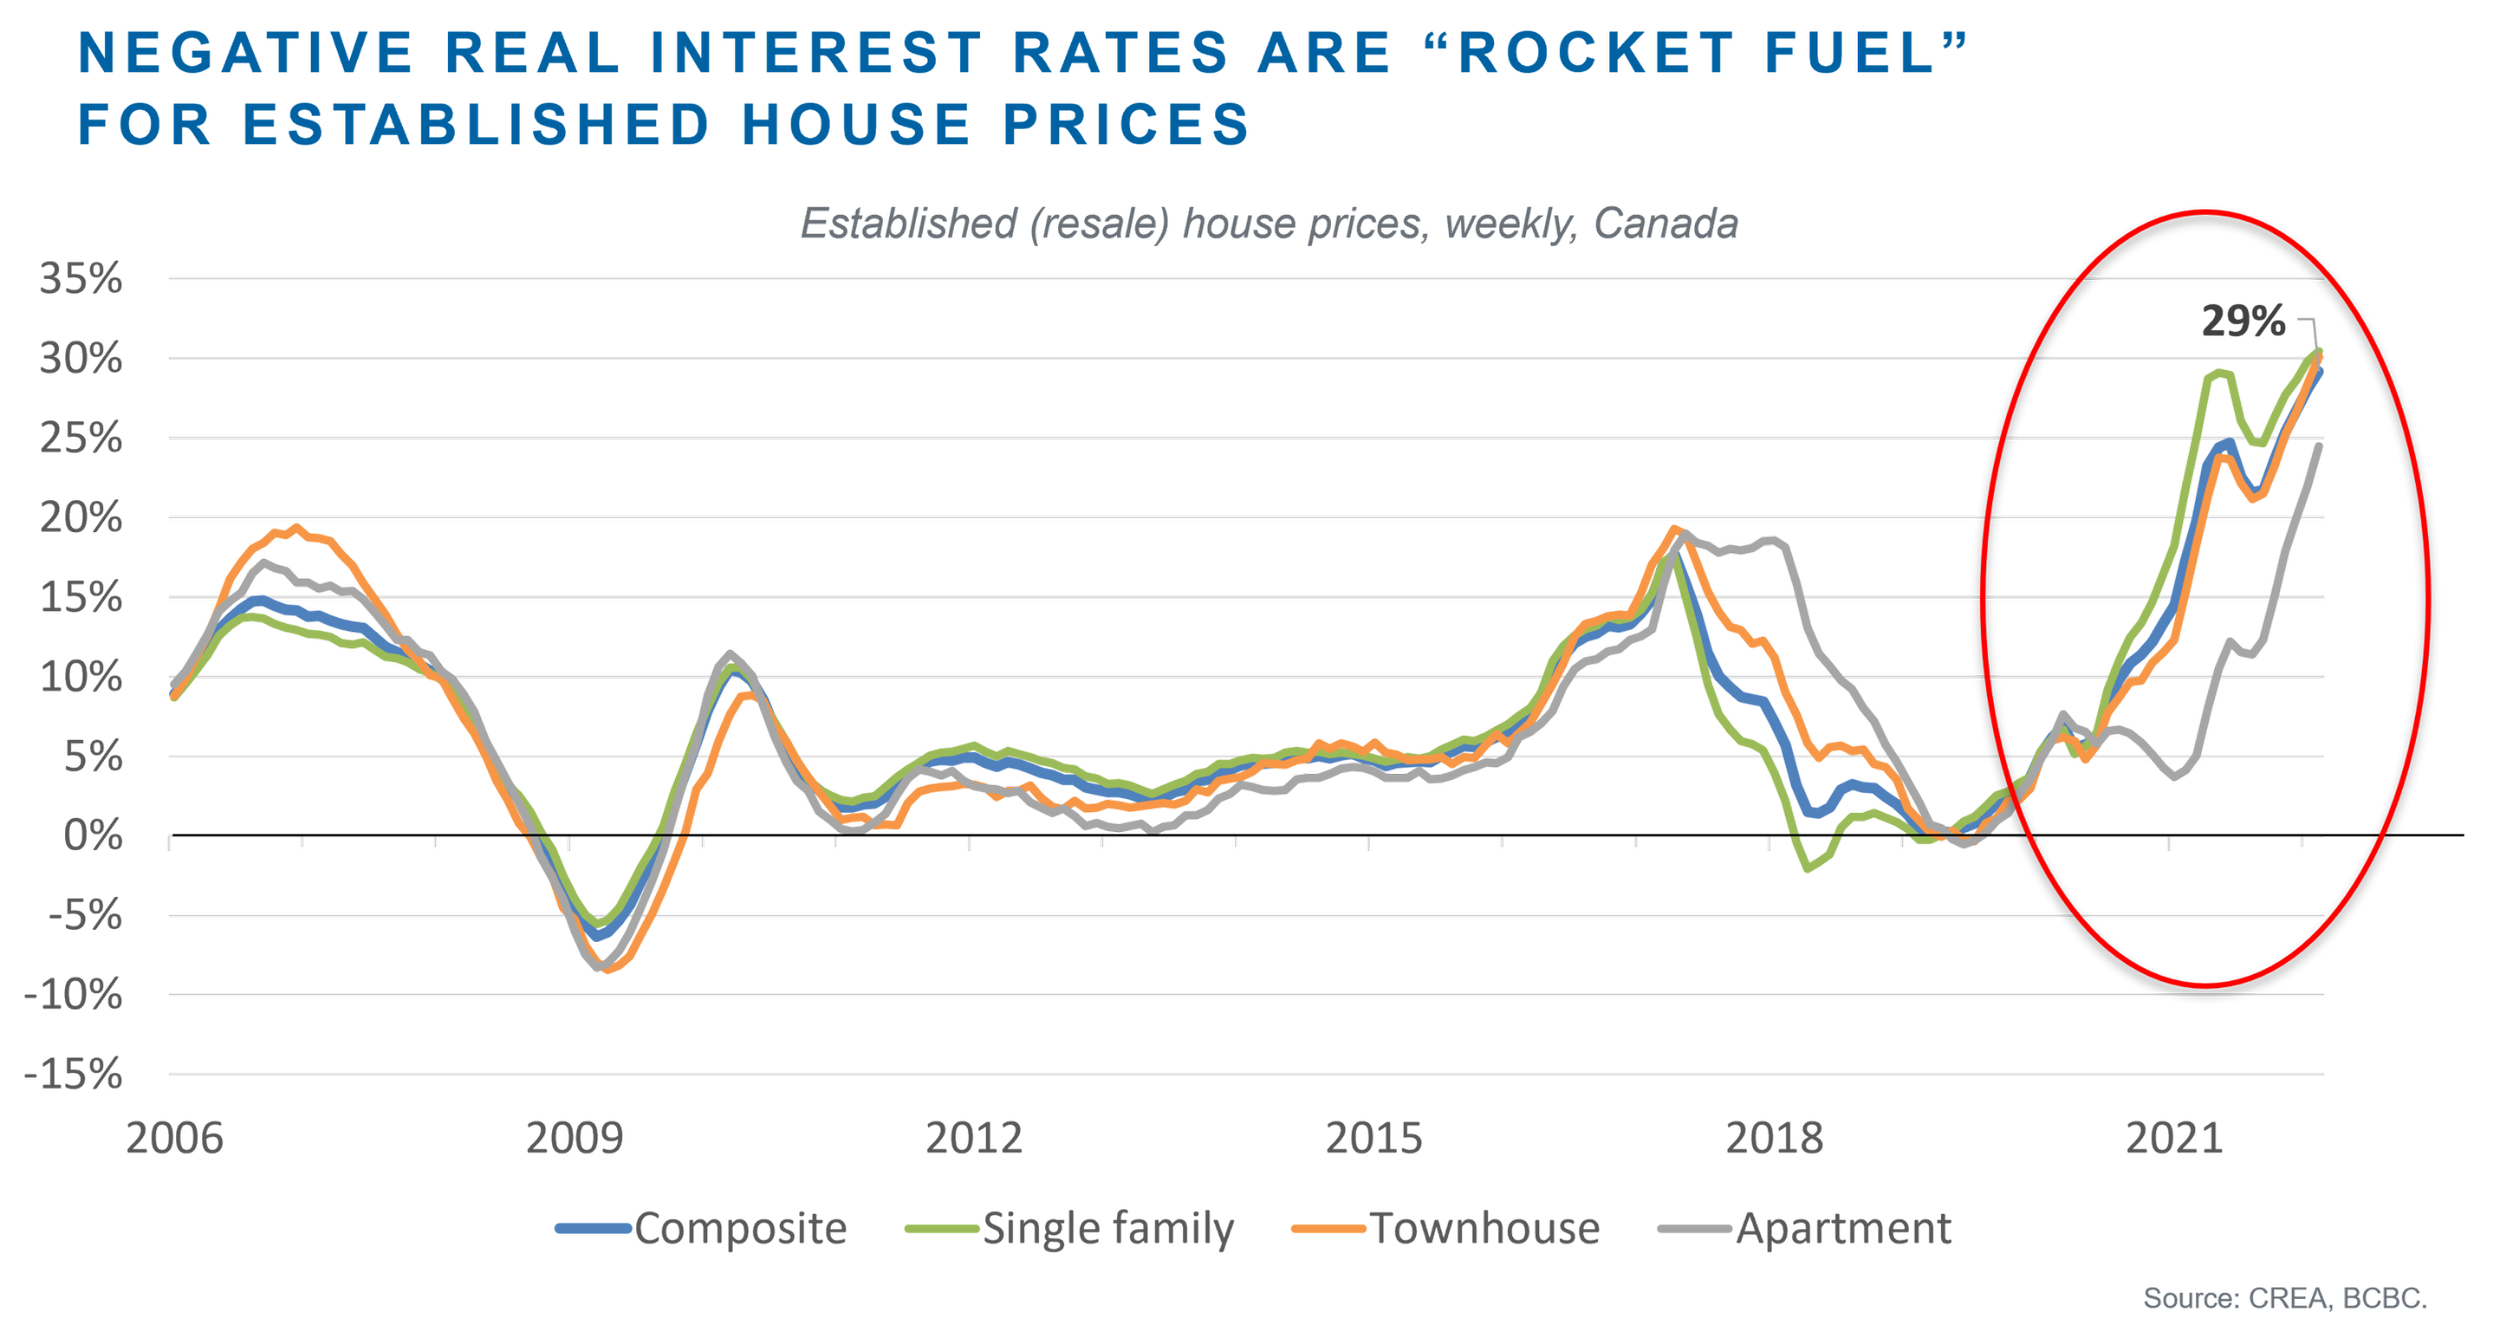
The situation is even starker in after-inflation terms (Figure 3). Let’s assume a borrower expects future inflation of 2% per annum (the Bank of Canada’s target). Based on that assumption, ex-ante real variable mortgage rates have been as low as -0.74% and are currently -0.55%. However, CPI inflation has exceeded the 2% target for 13 consecutive months and was more than thrice the Bank of Canada’s target at 6.7% y/y in March 2022. This means the ex-post real variable mortgage rate is around -5.25%. Borrowers are effectively being "paid" to take loans, in after-inflation terms. Is it any wonder that mortgage demand has exploded and sent established house prices soaring?
Figure 3

What have been the effects of Ottawa’s pro-credit policies?
Table 1 lays out changes in demand-side indicators and supply-side indicators in the established (resale) and new housing markets between 2016 and 2021.
Table 1

Several findings become clear from Table 1:
Household disposable income (nominal) jumped by 20% between 2016 and 2021. Meanwhile, growth in real GDP per capita was very low at just under 3% in total between 2016 and 2021, while consumer inflation was 10%. It becomes clear from the very sizable remainder that household disposable income growth was propped up by massive government transfers to households (especially in 2020) – financed by public debt. The transfers are not sustainable. But without them, gains in real household disposable income would have been slim.
Variable mortgage rates fell by 80 basis points (0.8%) in nominal terms, and by an incredible 274 basis points (2.74%) in real (after-inflation) terms. With no offsetting tightening of macroprudential regulations, these extraordinary reductions in real borrowing rates drove a spectacular $480 billion (35%) increase in Canadians’ demand for mortgage credit.
The impact of the credit boom on consumer spending was modest because the pandemic restricted opportunities to spend in 2020 and the first half of 2021. Consumer credit increased by a relatively muted $36 billion (6%) over 2016-2021, while home equity lines of credit (HELOCs) decreased by $20 billion (11%). Consumer price inflation was a modest 10% over 2016-2021. As the economy reopened following the worst of the 2020 COVID shock, CPI inflation accelerated in the second half of 2021 (as discussed here and here).
There is no evidence of a national housing supply shortage, in aggregate. The Canadian housing stock increased by 872,000 dwellings (5.7%) from 14.7 million to 16.3 million dwellings in 2021. The “effective” housing stock, based on the number of dwellings occupied by usual residents (i.e., excluding empty homes), increased by 907,000 dwellings (6.4%). In either case, the percentage increase in the number of dwellings in Canada exceeded the percentage increase in the population (5.2%) and number of households (6.2%) over this period. Moreover, the increase in the number of households (+914,000 households) almost exactly matched the increase in the “effective” housing stock (+907,000 dwellings).
It is implausible that a difference of 7,000 dwellings in total – between the number of households and the number of dwellings available for occupation – is the primary driver of the 56% jump in Canadian established dwelling prices over 2016-2021.
The best that can be said is this. Residential building activity is at a record share of GDP. Had Ottawa not been pursuing century-high rates of immigration and population growth (which have had a trivial impact on GDP per capita), growth in the number of dwellings over 2016-21 might have exceeded growth in the number of households. That potential surplus of new dwellings could have helped dampen the rise in established house prices relative to incomes, and at least partly offset the increase caused by the mortgage credit tsunami. Unfortunately, Ottawa unwittingly dropped the ball on this opportunity by cranking up mortgage credit demand and immigration levels at the same time.
Residential investment (including expenditures on new construction, renovation construction and the cost of transferring ownership of real estate assets) rose to a record 8.0% of Canada’s GDP. By industry, the residential construction sector's output increased from 2.7% to 3.0% of GDP at basic prices (the sector hit a record 3.2% of all-industry GDP in 2021 Q2). Also, housing starts increased to 271,198 dwellings in 2021, a 37% increase over 2016 rates of construction.
It is therefore hard to make the case that there is an overall lack of economic resources in Canada directed toward new residential construction, renovation construction, and turnover of real estate asset ownership.
New house prices rose by a relatively modest 18% over the 5 years – less than the rate of household disposable income growth (20%)! This is further evidence that new housing construction has kept pace with new household formation, despite claims to the contrary by Ottawa policymakers. (Note, new house prices jumped over 2020 and 2021 after interest rates were slashed, but new house prices had been falling prior to that).
While the stock of dwellings increased around 6% over 2016-21 to 16.3 million dwellings, the increase was partly offset by 35,000 homes being removed from use (i.e. not occupied by usual residents). The effective housing stock was therefore 15.0 million dwellings in 2021, up 6.4% from 2016. Still, the increase in the total housing stock and effective housing stock exceeded both growth in the population and the number of households.
The 2022 Federal Budget announced $10.14 billion in spending over five years towards increasing the housing stock. However, this is dwarfed by what has happened on the demand side: there was a $480 billion explosion in mortgage credit over the previous five years. The increase in mortgage credit is 4,800% larger! The housing supply measures in Budget 2022 cannot be expected to have a meaningful impact on average established house prices in Canada. Higher interest rates and greater restrictions on credit access for housing investors are likely to be far more impactful in reducing established house prices relative to incomes.
Overall, the 300-basis point reduction in real mortgage rates over 2016 to 2021 caused a massive $480 billion (35%) increase in demand for mortgage credit. Along with the 20% surge in household disposable incomes, demand-side factors are largely responsible for the 56% increase in established house prices over 2016 to 2021 (Figure 4).
Econometric research and further reading about the determinants of Canadian established house prices can be found in Muellbauer et al. (2015) and Williams (2021).
Figure 4
It’s time to focus on growing GDP per capita and real incomes
It is not a coincidence that Canada has the 5th most indebted household sector in the world (primarily consisting of mortgage debt) and some of the world’s highest ratios of established dwelling prices to incomes for its intrinsically land-constrained gateway cities (see here). Federal policymakers concerned about the price of established (resale) dwellings should look to the effects of their own macroeconomic, macroprudential and regulatory policies that have stimulated rapid growth in demand for credit.
Policymakers should reflect on the appropriateness of boosting household disposable incomes, through increased government transfers funded by government borrowing, as compared to a situation where faster household market income growth is achieved through gains in productivity and GDP per capita. Moreover, at the aggregate level, there is little evidence that Canada should be devoting even more economic resources to housing assets and the financing of them. Despite claims to the contrary, growth in the housing stock over 2016 to 2021 roughly matched growth in the number of households. Residential investment is a record share of GDP. The booming construction sector already faces serious capacity constraints – resulting in trade labour and construction cost inflation becoming embedded in new
house prices.
Canada’s housing finance system makes it very easy to obtain a mortgage at extraordinarily low interest rates, especially for existing homeowners and investors who can collateralise windfall housing capital gains. When real interest rates are negative, borrowers are being “paid” to take the mortgage in after-inflation terms. Hundreds of billions of dollars of mortgage loans, and most of the deposits that fund them, are insured by the Canadian taxpayer. Furthermore, macroprudential rules are adjusted on an ad hoc basis through an opaque decision-making process, making them slow to respond to market conditions.
What Canada really needs is to start focusing on generating higher rates of non-residential business investment per worker that will lift labour productivity and real incomes over time. Research by Robson and Wu (2021) found that Canadian non-residential investment per worker is declining across all asset types and is not even keeping up with depreciation. The non-residential capital stock per worker is shrinking – an extraordinary trend that bodes ill for future Canadian living standards. It requires some Pollyanna-type thinking to believe that a shrinking business capital stock per worker will not lead to lower growth in productivity and real incomes over time.
Global interest rates are rising quickly. The five-year Canada government bond rate, a benchmark used by mortgage lenders, has jumped from 0.4% in January 2021 to 2.8% today – a 240 basis point turnaround in 16 months. The “sugar high” offered by cheap credit is coming to an end. All else being equal, the modelling in Muellbauer et al. (2015) predicts that materially higher real mortgage interest rates will result in a substantial moderation in mortgage credit and established dwelling price growth within five years (and most noticeably within the window of two to three years).
The 2022 Federal Budget offered some recognition (see pages 25-26) that Canada’s real economy has unaddressed structural problems: very low and declining rates of private business investment per worker; difficulties in getting small companies to grow beyond a certain level – in part reflecting Canada’s curious two-tier corporate income tax (CIT) regime; low labour productivity growth since 2000; and real GDP per capita growth that has been slow and is projected to be dead last in the OECD over the next four decades.
Recognition of these longstanding problems is a start. As the “sugar high” of the credit boom becomes a “sugar low,” Canada will need to get serious about addressing these problems. BCBC has proposed the establishment of an Australian-style Productivity Commission. In our view, this is a superior structure to the proposal contained in the 2022 Federal Budget to establish a permanent Council of Economic Advisors. In contrast, an Australian-style Productivity Commission would be a permanent, transparent, and fully staffed institution. Operating at arms-length from government, the institution can marshal expertise in microeconomic reform and the rigorous evaluation of policy alternatives, engage the public in public inquiries and consultations, and make evidence-based recommendations to government about how to improve productivity and real incomes. Now would be a good time for Ottawa to embrace it.
Note - An earlier version of this blog misstated the 2016-21 growth in total private dwellings as 8.7%. This has been corrected to 5.7% above.