
Which industries “pay the bills” for British Columbia? An update
A previous blog explored why British Columbia has a lower average standard of living, as measured by real GDP per person, than all other Pacific Northwest regions except Idaho. This blog will examine where B.C. generates its highest output per unit of labour input and identify the industries that make up B.C.’s “economic base”. As Nobel Laureate Paul Krugman famously remarked:
Productivity isn’t everything, but in the long run it is almost everything.
A country’s ability to improve its standard of living over time depends almost entirely on its ability to raise output per worker.
B.C.’s highest productivity sectors
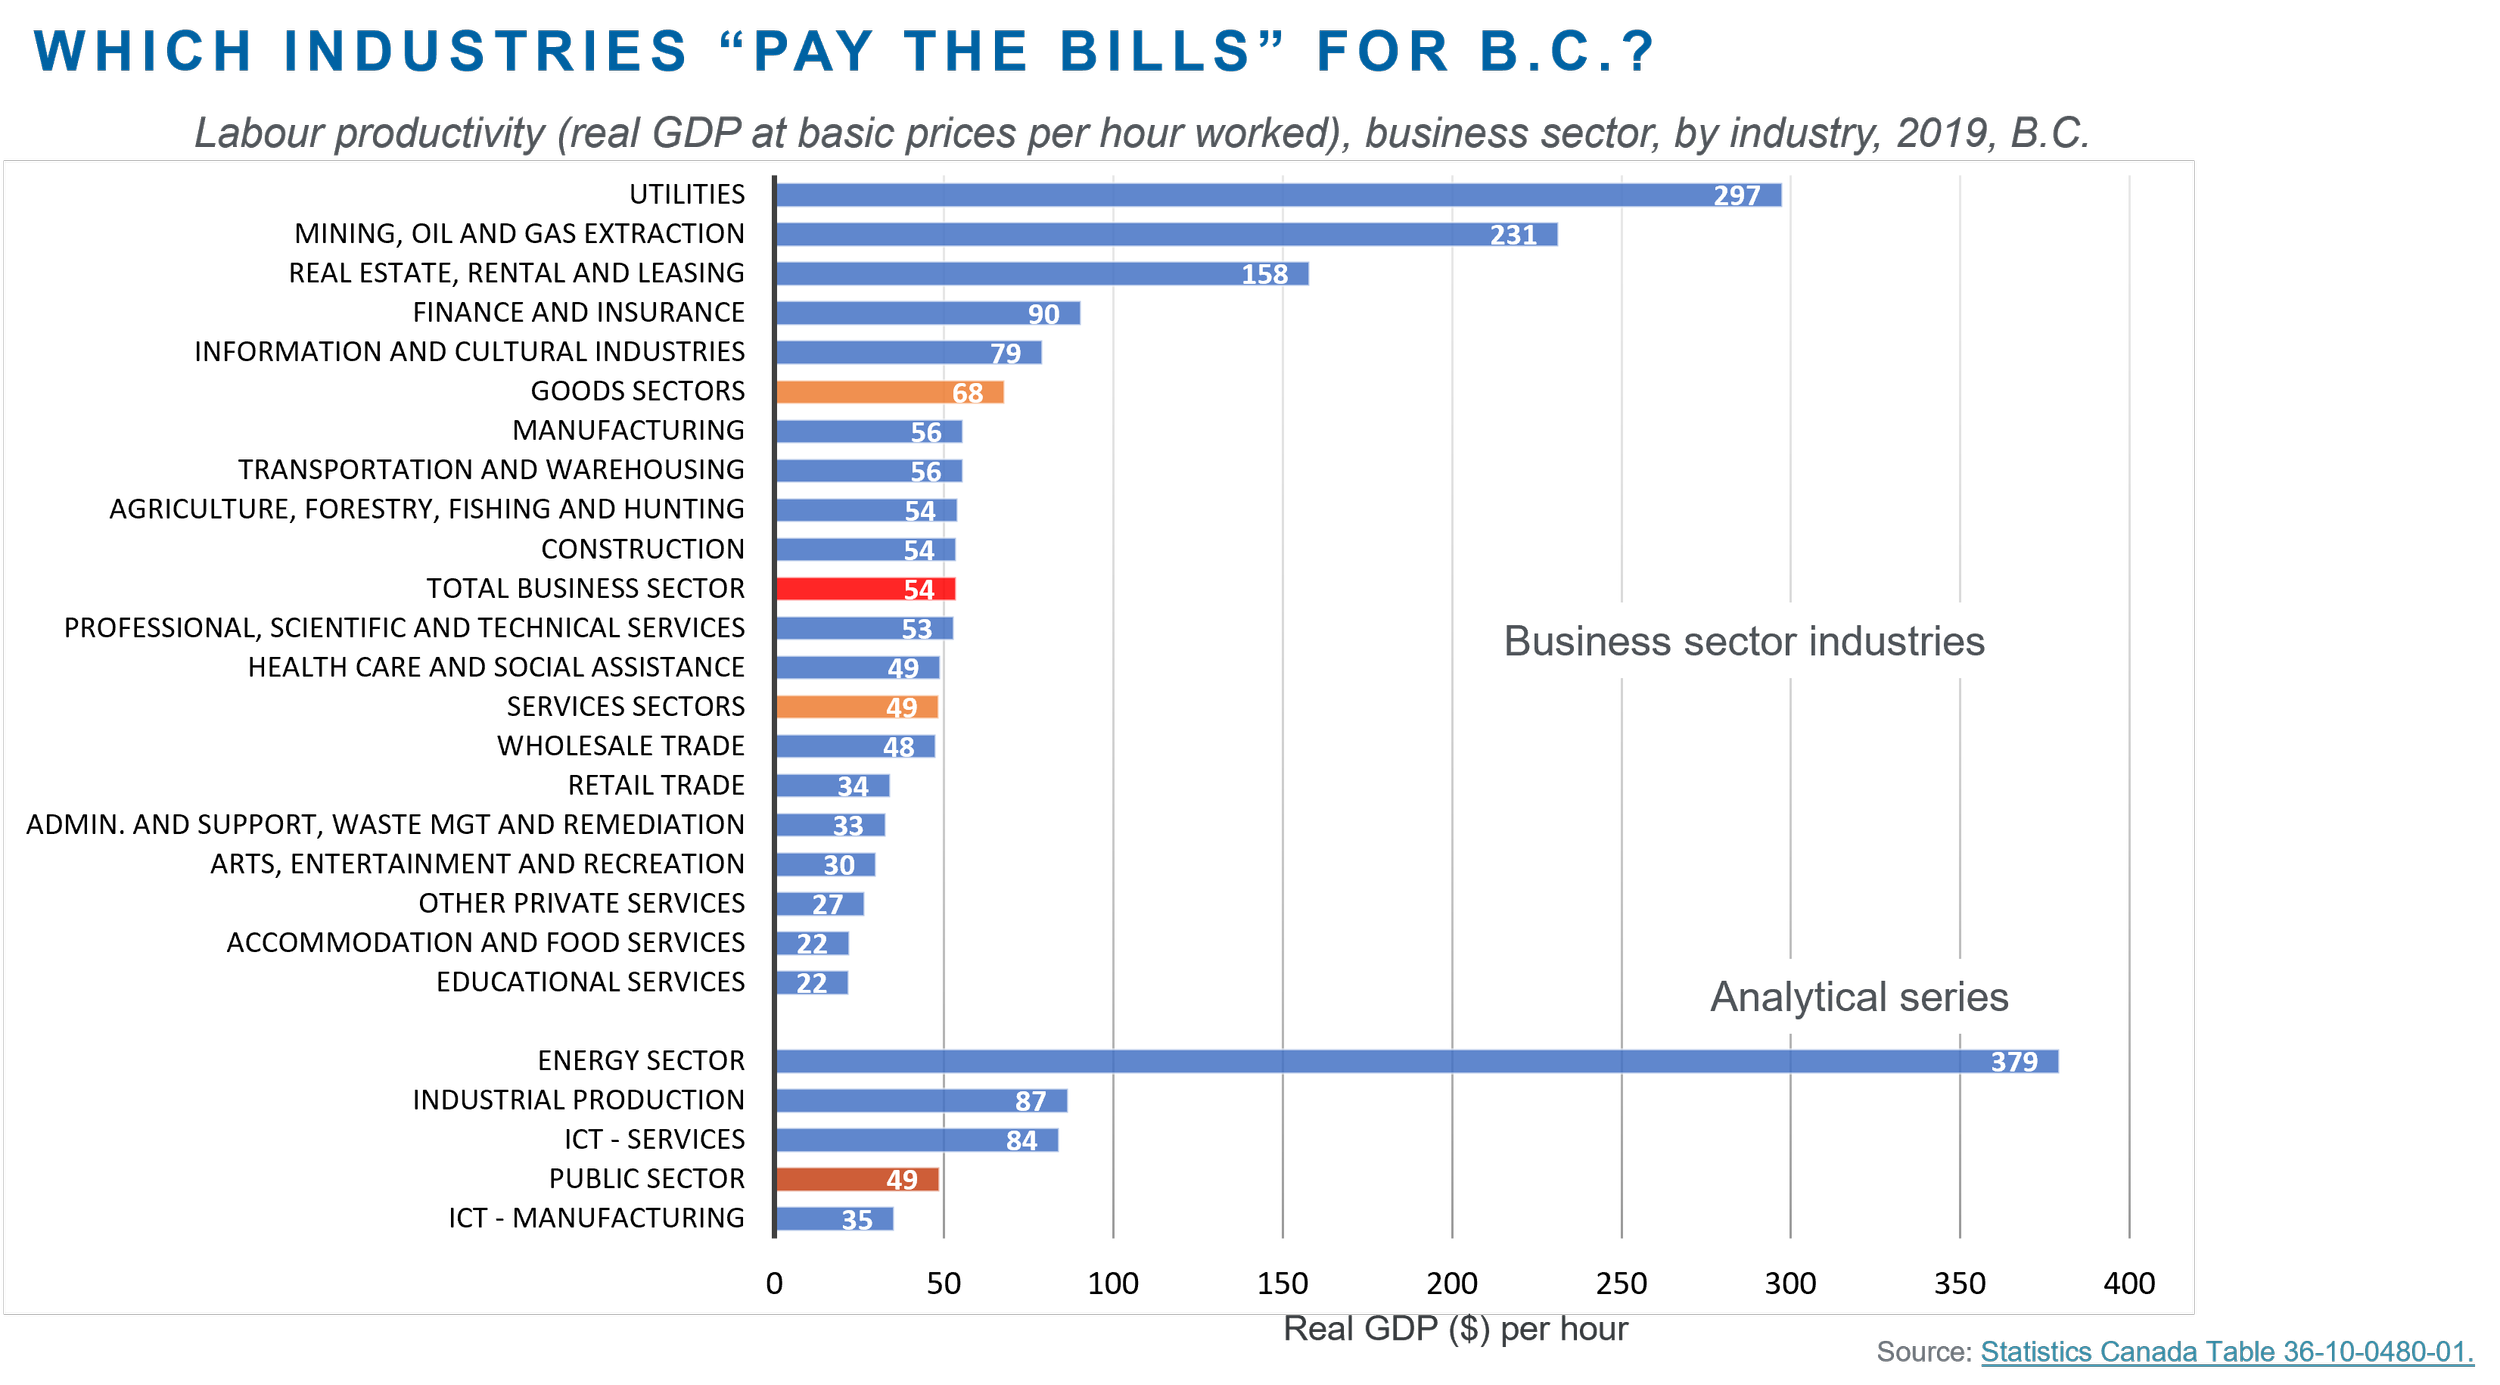
B.C.’s highest labour productivity sectors are in natural resources (Figure 1). Using 2019 data (the year prior to the pandemic), the mining, oil and gas production sectors – which notably are capital-, skill- and technology-intensive, produce at scale, and export to the global marketplace – generate $231 of real GDP at basic prices (“value-added”) per unit of labour input. This is almost five times the province-wide business sector average of $54 per hour worked. Also, the utilities sector, though making up a very small share of GDP, packs a disproportionately large economic punch, generating around $300 of value-added per hour.The next highest value-added per hour B.C. sectors are leasing ($158 per hour), finance and insurance ($90), information and cultural industries ($79), and finance and insurance ($79). Manufacturing, transport and warehousing, agriculture and forestry, construction, professional services, private health care, and wholesale trade are all around the business sector average of $54 per hour. Overall, B.C.’s goods-producing sectors generate $68 of value-added per hour, while services sectors on average generate $49 of value-added per hour. A further decomposition is provided by Statistics Canada’s analytical series which tally up combinations of similar sub-industries across the major sectors. Energy-producing sub-sectors generate a substantial $379 of value-added per hour. Industrial production and information and communications technology (ICT) services generate similar levels of value-added per hour at around $85. The public sector generates around $49 per hour, which is slightly less than the business sector average of $54 per hour.
Figure 1
B.C.’s economic base
The high levels of income generated upstream from B.C.’s highest GDP per hour sectors create demand downstream for goods and services produced in other sectors of the provincial economy. The provincial government’s “Economic Plan 2019-20” highlighted the importance of B.C.’s “economic base”, defined as the “industries responsible for bringing dollars into the province through the export of goods and services.” [emphasis added]. Dollars brought into the economy circulate among domestic industries, such as real estate and construction. Wright (2019: 15) explains these concepts as follows: The concept of the economic base…is different from GDP. GDP measures the output of the entire economy; the economic base measures the dollars brought into the economy through exports of goods and services. Real estate and construction, while a significant part of the domestic economy, is primarily the result of the incomes generated from the economic base and the dollars circulating within the domestic economy. So, what industries make up B.C.’s economic base? What do international customers want to buy from us? In other words, what do international customers think British Columbians are comparatively good at producing? Figure 2 presents the data from Wright (2019: 15). The data includes B.C.’s merchandise (goods) exports, and through the use of input-output tables, an estimate of services sector output that is associated with the export economy.
Natural resources sectors – forestry, mining, agri-food and energy – make up about half of B.C.’s economic base. Gateway services contribute another one-seventh (14%) of the base and include transport and logistics services associated with the Vancouver and Prince Rupert marine ports, Vancouver’s international airport and B.C.’s road and rail transport systems. Together, natural resources and gateway services make up two-thirds of B.C.’s economic base. In addition, other manufacturing activities contribute 16% of export earnings, while high-tech sectors and film production contribute 6%. Finally, exports of leisure tourism and finance, insurance and real estate services contribute around 6-7% of export earnings.
Figure 2

Conclusion
B.C.’s average standard of living, as measured by real GDP per person, is ultimately determined by its labour productivity (i.e. value-added produced per unit of labour input). While it is true that real incomes can temporarily be boosted by favourable shifts in Canada’s and B.C.’s external terms of trade (i.e. export prices relative to import prices), as occurred during the commodities boom of the 2000s, such events tend to be fleeting and, furthermore, are beyond our control.
The data above shows the industries where B.C. is: (a) highly productive, generating high value-added per unit of labour input; and (b) has demonstrable advantages in international trade. The data shows what the rest of the world wants to buy from us – what international customers think B.C. is good at producing relative to other jurisdictions. These are the industries that “pay the bills” for British Columbians. Policymakers should pay attention to the make-up and health of the province’s economic base – on which our standard of living depends.